Understanding Latency in AI Model Deployment
Components that make up latency in AI Agents

Aryan Kargwal
PhD Candidate at PolyMTL
Published
Topic
Model Deployment

Stakeholders see a 500 ms response time and ask why the GPU can’t “just be faster.” You see traces where only a slice of that budget is actual model compute. The rest leaks away on the wire, in queues, inside tokenizers, and in the decode loop while batching tries to keep the bill under control.
Latency in AI systems lives in that gap between what the user feels and what the GPU does. Every request walks the same path: leave the device, fight its way through your network, sit in a queue, then grind through pre-fill and decoding before the answer appears. Each stage has its own limits, knobs, and failure modes. Most teams measure the total and then guess.
This article takes that request, step by step, from query to final token. You’ll see exactly which parts of latency you can control, which ones are price decisions disguised as “performance,” and how to tune each stage so you get the best speed you can justify paying for.
What is latency in AI model deployment?
Latency is what your user feels in the gap between “send” and “this answer is usable.”
On the surface, it looks like a single number. Someone loads a dashboard, sees 480 ms P95, and decides the system is “fast enough” or “too slow.” What the user actually experiences is more granular.
From the system side, this “one” latency number is the sum of several distinct stages along the path from client to GPU and back. Each stage has different owners, different levers, and different failure modes. When you compress everything into a single SLA, you hide the parts that are easy to fix and blame the one that is expensive to change.
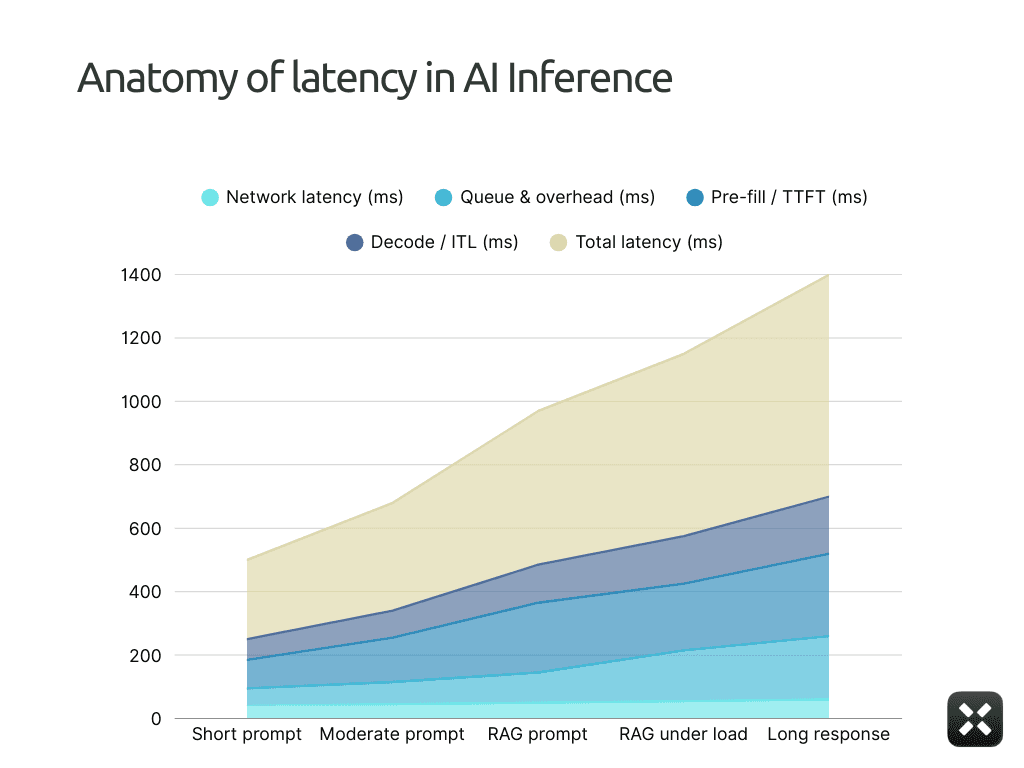
For the rest of this article, we’ll treat end-to-end latency as a budget made of four pieces. The diagram here makes that explicit: a single bar split into four segments, from user request to final token.
Network distance: how long the request spends on the wire between the user and your serving stack
Queue and system overhead: how long it waits inside gateways, schedulers, and middleware
Pre-fill compute (TTFT): how long it takes to process the prompt and emit the first token
Decode bandwidth (ITL): how quickly tokens stream after that first one appears
Once you see latency as these four buckets, you can stop guessing and start deciding which part you are willing to pay to fix.
Stage 1: Network and Topology
This is the cleanest number in the whole system, and that’s exactly why people underestimate it.
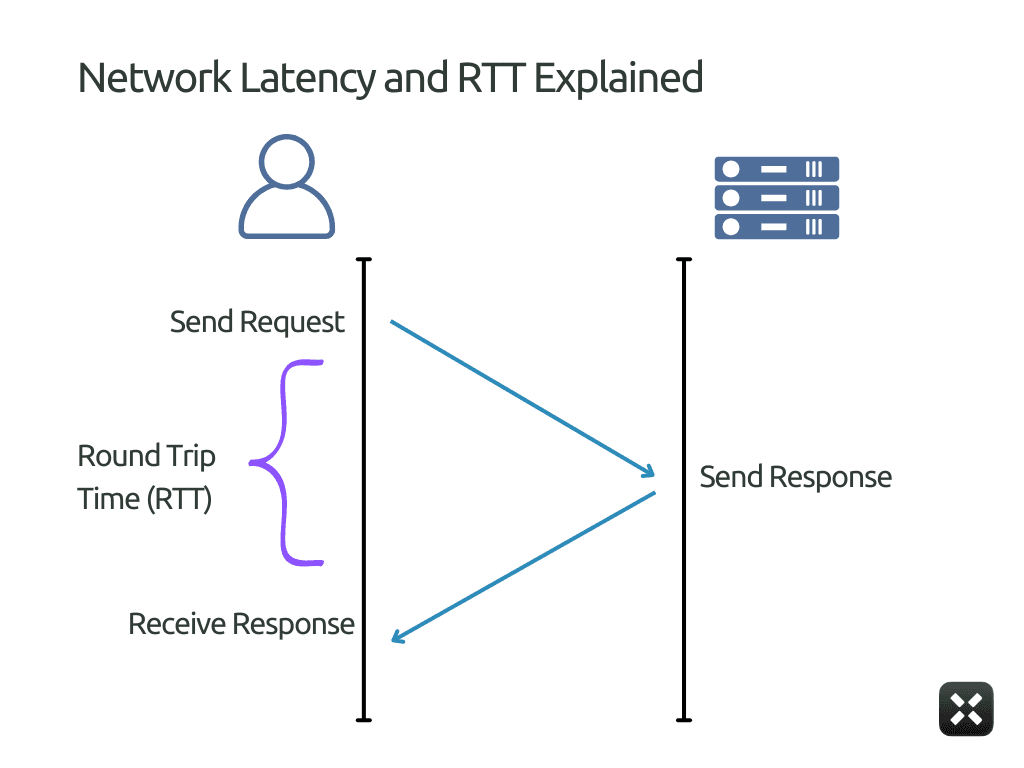
In the diagram above, this is the round-trip path between the client and the inference service. It’s the same class of delay you see in tools like Ookla or Fast.com: the time it takes a request to leave the user, reach the serving region, and come back.
That’s why this part of the timeline looks flat and stable in the diagram. Network latency does not depend on the prompt, the batch size, or the model. As long as the user location and serving region don’t change, the network latency segment barely moves.
You can reduce it by placing infrastructure closer to users and removing unnecessary hops, but you can’t optimize it away. Once the packet reaches the server boundary shown here, all remaining latency comes from inside the system.
Stage 2: The Queue and System Overhead
If network latency is a fixed tax, queueing is where you rack up penalties.
By the time a request reaches this stage, it has already arrived at your system. Geography is no longer part of the equation. From here on, latency depends entirely on how much work the system accepts versus how fast it can serve it.
This is where long latency usually comes from.
Requests wait because workers are busy. After all, the scheduler is forming a batch, or because autoscaling has not caught up. None of this counts as model inference time. But the user still waits for it.
Unlike network latency, which remains flat, the queue segment grows as load increases. It is small when traffic is light and becomes dominant as the system approaches saturation.
This is often the fastest place to reduce latency without increasing compute spend.
Limit how long requests are allowed to wait
Cap batch assembly delay for interactive traffic
Separate user-facing requests from background jobs
Scale earlier instead of letting queues absorb load
Batching in queuing helps keep GPUs busy and unit costs low. That’s why managed inference endpoints offer materially lower prices for batch inference than for real-time requests (Example seen in Anthropic and OpenAI Pricing). You are being paid to wait.
When systems allow deeper queues and more aggressive batching, throughput improves and cost per token drops.
Stages 3 & 4: Inference Mechanics (TTFT & ITL)
Everything up to this point happens outside the model. Network latency and queueing decide how long a request takes to reach the model. From here on, the delay comes from the model itself.
Inference has two distinct phases. The first is the work required to process the prompt and emit the very first token. The second is the work required to generate the tokens that follow.
Time to first token (TTFT)
Time to first token is the delay between when the model starts working and when the user sees anything at all.
This is the moment that decides whether the system feels responsive or frozen. Even if the full response arrives quickly afterward, high TTFT kills perceived speed.
TTFT climbs for a few predictable reasons.
Prompt size: The model must read and encode the entire prompt before emitting anything. Long system prompts, few-shot examples, and RAG context all increase pre-fill cost directly.
Pre-fill batching: To keep GPUs efficient, systems often batch multiple prompts during pre-fill. Your request may wait while others are collected. Larger batches improve throughput but raise TTFT.
Memory and KV cache pressure: Long contexts require larger KV allocations and more memory movement. When memory is tight, allocation and synchronization overhead show up as higher TTFT.
Cold paths: The first request after a deploy, scale-up, or idle period often pays extra cost: initialization, graph capture, or cache warm-up. Users see this as a one-time stall before streaming starts.
TTFT is one of the most controllable parts of inference latency.
Shrink prompts aggressively. Remove repeated system text and cap retrieved context.
Cache static prompt prefixes and reused instructions.
Limit pre-fill batch size separately from decode batching.
Keep interactive models warm instead of scaling to zero.
Route long-context or RAG traffic away from low-latency paths.
TTFT is paid before the model produces any visible output. As covered in “AI Deployment Playbook”, large-model deployment is less about how powerful your hardware is and more about how intelligently you use what you already have.
Inter-token latency (ITL)
Inter-token latency measures how the model behaves after it has started responding. Once the first token appears, ITL describes how consistently the model can keep the conversation moving.
This is the metric users feel during the interaction. TTFT decides whether the system feels alive at all. ITL decides whether it feels smooth or frustrating. There are several factors affecting ITL some being:
Decode batching: To keep GPUs busy, systems batch token generation across multiple requests. If one request in the batch is slow, all others wait. Larger batches improve throughput but increase inter-token delay.
Sequence length growth: As generation continues, attention cost rises and KV caches expand. Later tokens take longer to compute than early ones, even if nothing else changes.
Shared GPU contention: When multiple active requests share a GPU, decode steps may be interleaved or delayed. This turns smooth streaming into bursty output.
Memory and KV cache pressure: As KV caches grow, memory movement and synchronization overhead increase, slowing token emission.
ITL is harder to control than TTFT because it is paid continuously. To reduce it, you have to implement techniques such as:
Limit decode batch size for interactive traffic
Isolate long or verbose generations from short chats
Cap maximum output length on user-facing paths
Avoid mixing heavy and light requests in the same batch
Track ITL percentiles, not just average tokens per second
In practice, higher throughput almost always increases inter-token latency. Managing ITL is about choosing how much efficiency you’re willing to trade for smooth, predictable output.
Top Ways to Debug Latency Complaints
Once you understand what actually makes up latency, most “the model is slow” complaints stop being vague. They map cleanly to the same few failure modes.
The table below lists the most common complaints teams hear, their typical meanings, and where to look first.
What people complain about | What’s usually happening | Where the time is actually going | What to fix first |
“It’s slow even for tiny prompts.” | The system is slow before inference starts | Network or queueing | Check serving region vs users, kill cross-region hops, cap queue depth |
“It feels fine locally but bad in production.” | Load exposes the queueing policy | Queue and autoscaling lag | Separate prod traffic, scale earlier, tighten concurrency limits |
“Nothing happens for a while, then it answers fast.” | Pre-fill is expensive | TTFT | Shrink prompts, cap RAG context, reduce pre-fill batching |
“It starts responding, then freezes or stutters.” | Decode is getting interrupted | ITL | Reduce decode batching, separate long and short requests |
“Latency explodes at peak hours.” | The system accepts more work than it can serve | Queue dominates | Lower batch delay, add priority queues, faster scale-up |
“Big customers feel slower than small ones.” | Heavy workloads block light ones | Queue + batching interaction | Per-tenant isolation, split background jobs |
“Cheaper batch mode works, live mode feels broken.” | Aggressive batching | TTFT and ITL stretched by design | Use batch only where humans aren’t waiting |
When a complaint comes in, don’t adjust the model first. Translate the complaint into a row in this table.
If the issue is before the first token, look at queueing and TTFT.
If the issue of inter-token latency measures how the model behaves after it has started responding. Once the first token appears, ITL describes how consistently the model can keep the conversation moving.
This is the metric users feel during the interaction. TTFT decides whether the system feels alive at all. ITL decides whether it feels smooth or frustrating. There are several factors affecting ITL, some of which are:
Decode batching: To keep GPUs busy, systems batch token generation across multiple requests. If one request in the batch is slow, all others wait. Larger batches improve throughput but increase inter-token delay.
Sequence length growth: As generation continues, attention cost rises and KV caches expand. Later tokens take longer to compute than early ones, even if nothing else changes.
Shared GPU contention: When multiple active requests share a GPU, decode steps may be interleaved or delayed. This turns smooth streaming into bursty output.
Memory and KV cache pressure: As KV caches grow, memory movement and synchronization overhead increase, slowing token emission.
ITL is harder to control than TTFT because it is paid continuously. To reduce it, you have to implement techniques such as:
Limit decode batch size for interactive traffic
Isolate long or verbose generations from short chats
Cap maximum output length on user-facing paths
Avoid mixing heavy and light requests in the same batch
Track ITL percentiles, not just average tokens per second
In practice, higher throughput almost always increases inter-token latency. Managing ITL is about choosing how much efficiency you’re willing to trade for smooth, predictable output.
Reassess your latency and cost trade-offs
If parts of this article sounded uncomfortably familiar, that’s usually a sign you’re paying for inefficiency without seeing it.
Most teams overpay for inference because they don’t know where time and GPU cycles are actually going. Latency gets blamed on the model. Cost gets blamed on scale. The real issue sits in between.
Run a real workload through your stack and trace it end-to-end. Look at network, queueing, TTFT, and ITL separately. You’ll quickly see what’s worth fixing and what’s already fine.
If you want a faster way to get that visibility, Pipeshift makes it straightforward to benchmark live workloads and spot where latency and cost drift out of balance.
